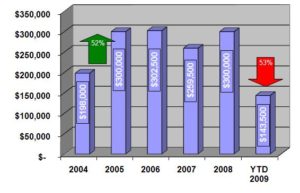
This chart shows the median land sales price changes since 2004 for vacant land in the Truckee Real Estate market. As you can see, prices have really taken a big hit so far in 2009. What's more, activity based by the number of sales this year has been abysmal. Much of the decline can be attributed to the lack of available construction financing. 2008's statistics are a bit of an aberration, as Continue Reading
Archives for September 2009
Median Condominium Price Graph for Truckee Real Estate for 2004 – 8/30/2009
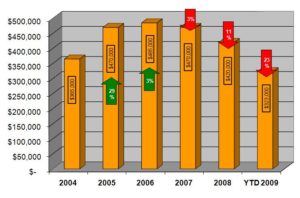
This chart shows the increases and decreases over the last 5 plus years, of median condominium values in the Truckee Real Estate market. This does not include some of the luxury condos in Northstar, or Old Greenwood, as some of those price points (1.6 million) skewed the stats a little bit. The median single family chart took about 20 hours for me to produce, and this one only took 5 or so. Continue Reading
Median Single Family Home Graph for Truckee Real Estate, 2004 – 8/30/2009
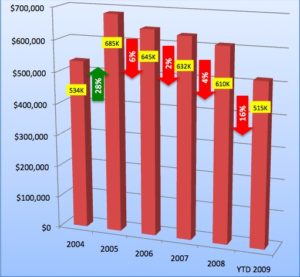
This fancy new graph (I've got about 20 hours in to this) is my first effort. It shows median prices in the overall Truckee Real Estate area from 2004 through August 30, 2009. To do the math for you, we are off the 2005 highs at about 28%. This is market wide here in Truckee, and only single family homes. Some neighborhoods have been hit harder. NOTE: This representation is based in Continue Reading
4th Quarter 2008 Single Family Residential Sales
Truckee Area Number of Sales Average Sold Price Median Sold Price Average Days on Market Donner Lake 1 $396,000 $396,000 168 Donner Summit 1 $335,000 $335,000 41 Downtown Truckee 32 $710,393 $845,000 78 Glenshire 10 $471,650 $380,000 130 Gray's Crossing 0 $0 $0 0 Lahontan 0 $0 $0 Continue Reading
Sold: $430,000 – 12740 Falcon Point Place, Truckee, California
Sold: $675,000 – 11561 Bennett Flat Road, Truckee, California
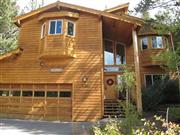
Sold: $675,000 - 11561 Bennett Flat Road, Truckee, California Majestic high vaulted pine ceilings, gorgeous windows and log accents highlight the warm and comfortable living area. The stunning gourmet kitchen, with a wonderful meadow view, has chipped edge granite counterops, breakfast bar, huge pantry, stainless appliances and Thermador 5 burner cooktop. The master suite is truly luxurious and Continue Reading